Life-Safety Consequences of Dam Failures in the U.S.
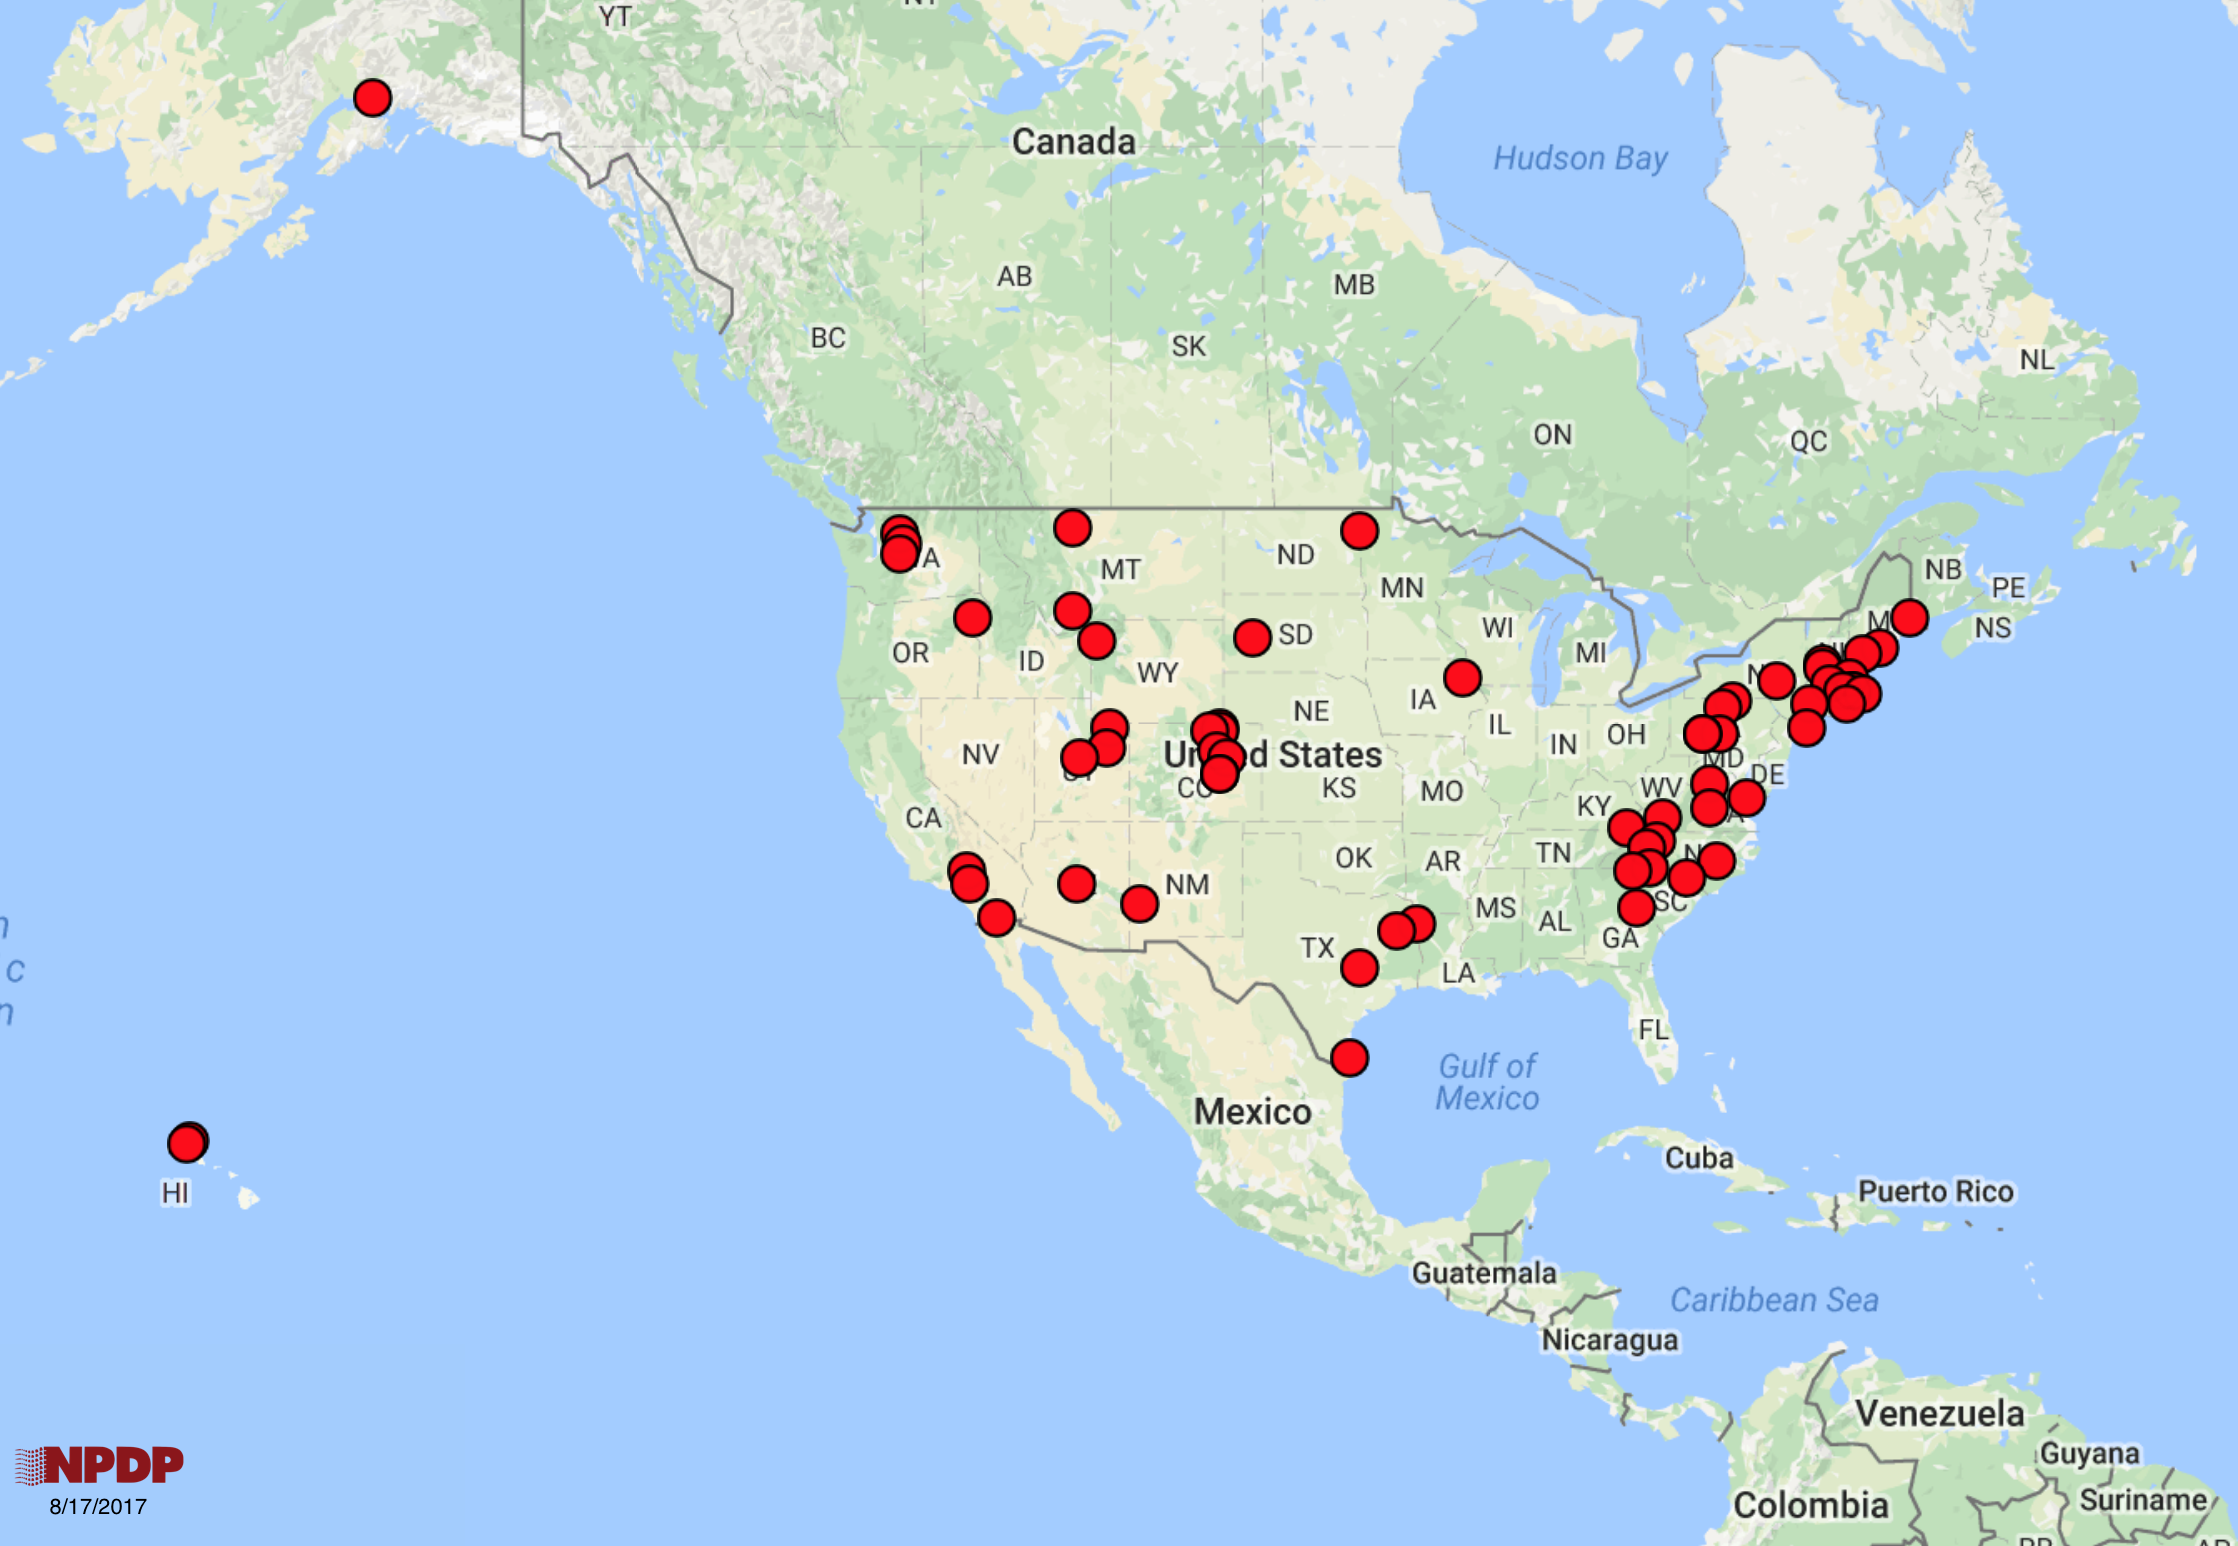
Since 1850, there have been 63 known dam failure events (exclusive of tailings dams) that have involved fatalities. Download a paper describing life-safety consequences in the U.S. here.
Database Summary
The following table provides a summary of the NPDP dataset on fatalities related to dam failures.
| Period of Record | |
| Number of Years of Record | |
| Number of Dam Failures Resulting in Fatalities | |
| Frequency of Occurrence per Year of Dam Failure Events in which there were Fatalitiesc | |
| Range on the Number of Fatalities that Occurred as a Result of a Dam Failure | |
| Total Number of Fatalities that Over the Period of Record (A range is shown based on the variation in the estimates of the number of fatalities that occurred) | |
| Average Number of Fatalities perYear Over the Period of Recorde |
a The dataset is based on information provided in Graham(1999), McClelland and Bowles(2002), the US Bureau of Reclamation(2014), and the NPDP archives. The dataset does not include fatalities associated with tailings dams. The NPDP database does not have a complete list of events involving tailings dams.
b The Staffordville Reservoir failure in 1877 is not included in this value. Documentation of this failure indicates fatalities did occur, however, there is no information on how many (Jorgenson 1920)
c This is simply the number of events divided by the number of years in the record.
d This is the range on the number of fatalities that have occurred.
e Calculated as the total number of fatalities divided by the number of years of record. The range of calues reflects the differences in the estimated number of fatalities in the historic record.
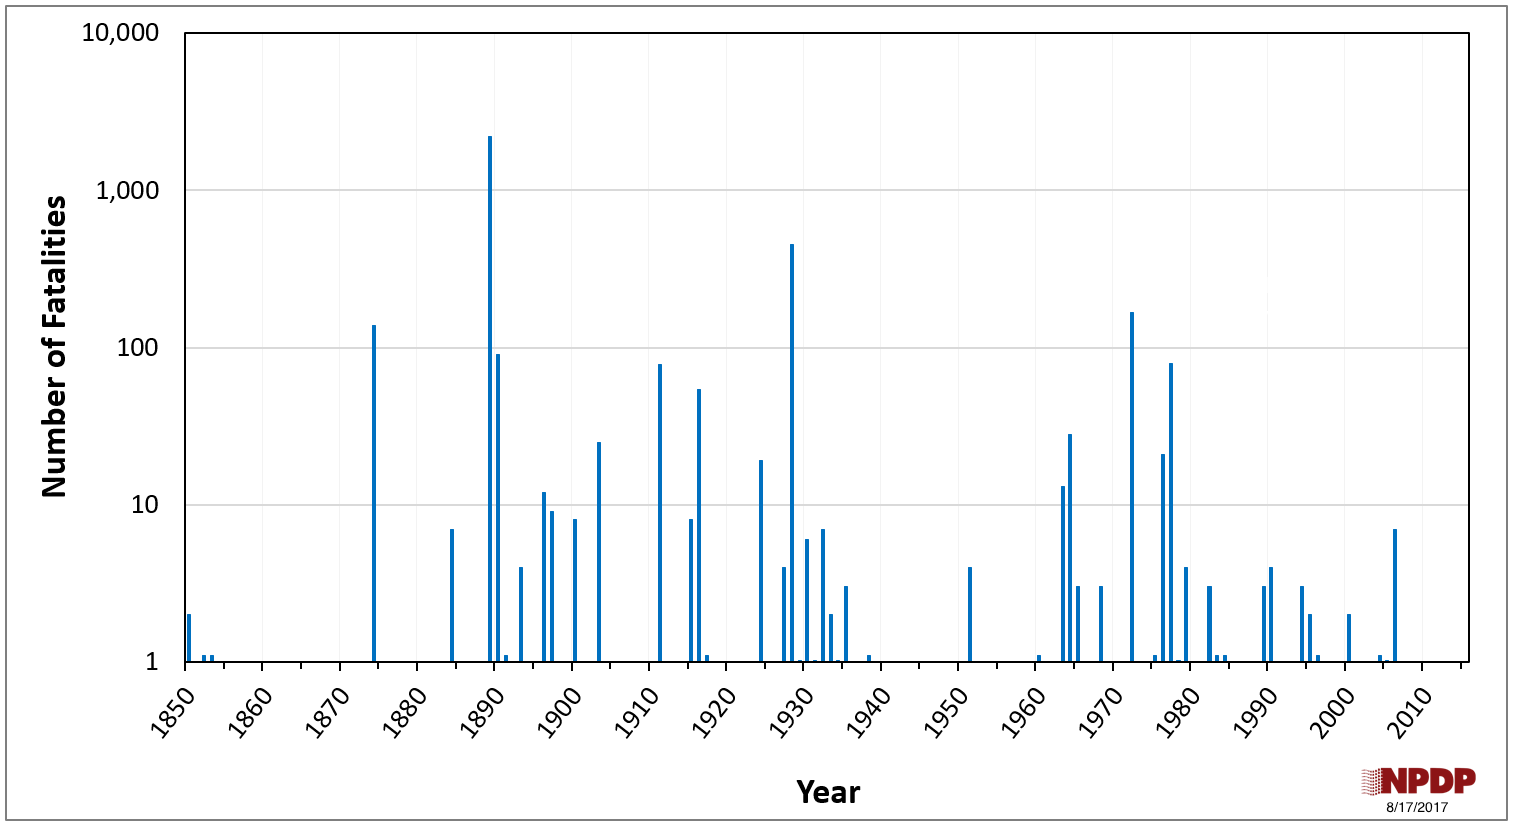
Timeline of Fatal Dam Failure Events
The figure below shows a timeline of the number of fatalities that have occurred in the U.S. during dam failure events.
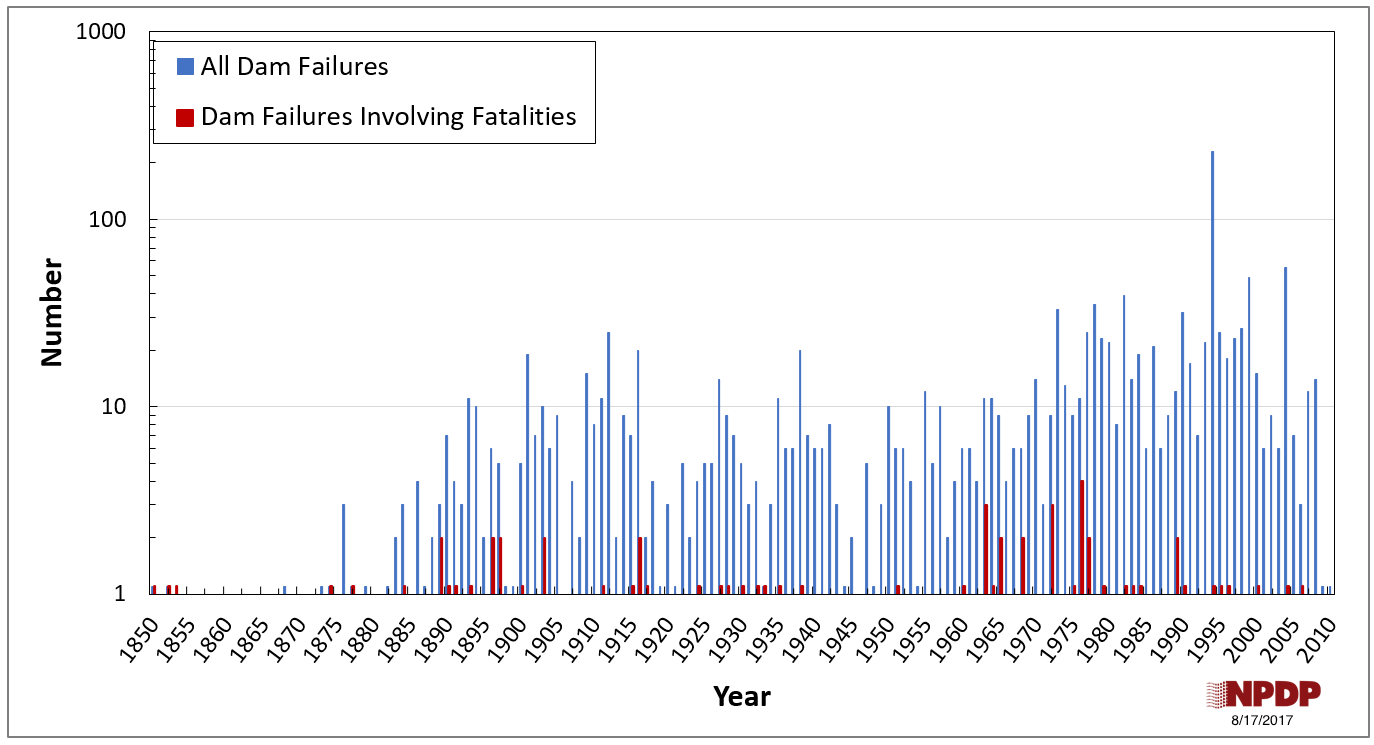
This figure shows a timeline of the number of dam failures and the number of dam failures that have involved fatalities in the U.S. Approximately 4% of dam failures in the U.S. have involved fatalities.
Number of Fatalities
The number of fatalities that do/do not occur during a dam failure is a function of a number of factors. These include (but are not limited to):
- Size of the dam and reservoir
- Severity (depth, velocity and arrival time) of flooding that occurs downstream
- Population-at- risk at the time of the failure (time of year, time of day)
- Location of the population-at- risk downstream of the dam and in the area that is inundated
- Location of safe havens
- Effectiveness of local emergency management services
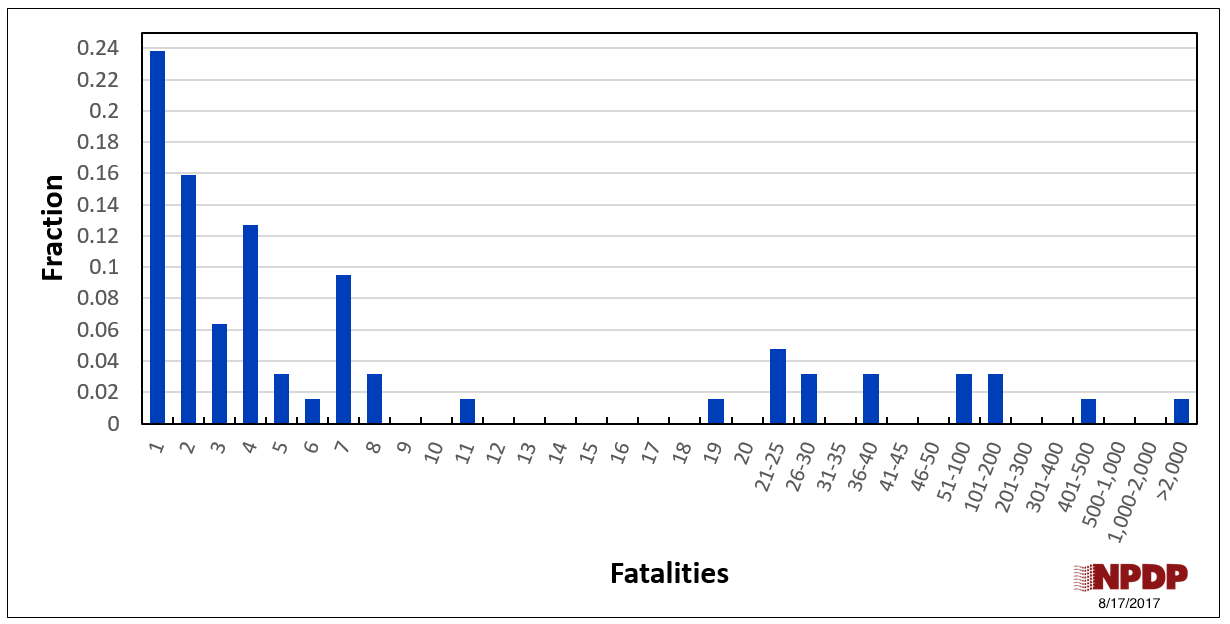
The figure below shows the distribution on the number of fatalities that have occurred during dam failure events.
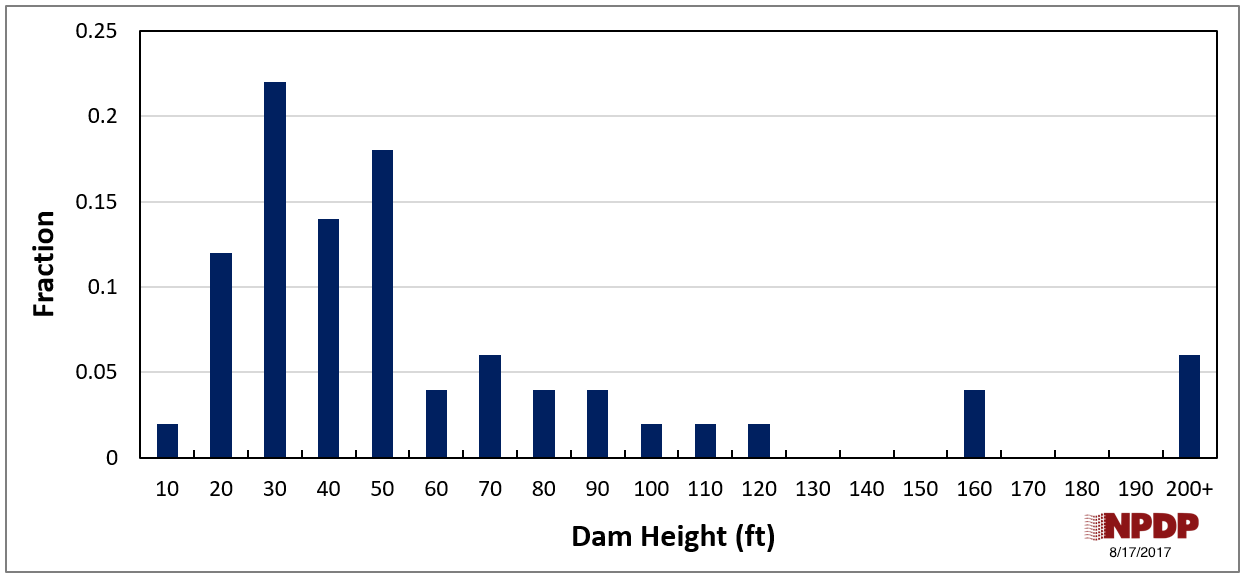
The next figure shows the distribution on the height of dams that have failed and had fatalities. The majority of the dams have been 50 feet or less in height.
Graham, W. (1999). "A Procedure for Estimating Loss of Life Caused by Dam Failure," US Bureau of Reclamation, http://www.usbr.gov/ssle/damsafety/TechDev/DSOTechDev/DSO-99- 06.pdf.
McClelland, D. M. Bowles, D. S. (2002). "Estimating Life Loss for Dam Safety Risk Assessment-- A Review and New Approach." Report 02-R- 3, Institute of Water Resources, US Army Corps of Engineers.
U.S. Bureau of Reclamation. (2014). "RCEM – Reclamation Consequence Estimating Methodology: Dam Failure and Flood Event Case History Compilation (Draft)." US Department of the Interior, Bureau of Reclamation.